
Claude dashboards are here. So is chart junk.
Claude dashboards turn your connected apps into one live view. Five questions decide whether yours gets used or quietly ignored.
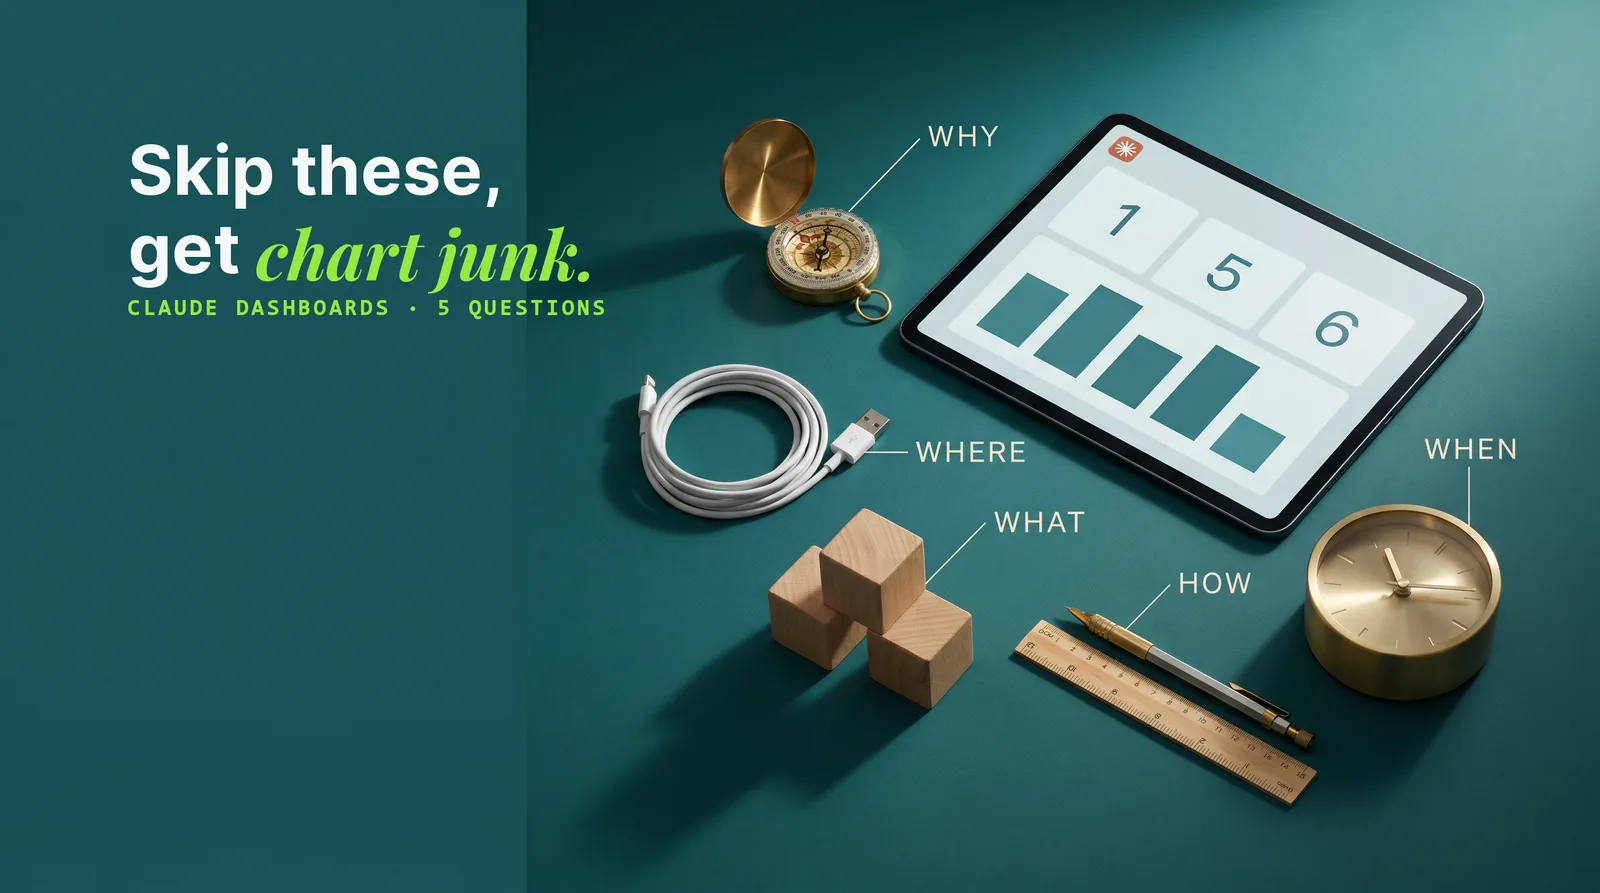
Claude dashboards are live, shareable dashboards that Claude builds inside Artifacts from the apps and data warehouses you have connected, designed and edited in plain English. A dashboard pulls numbers from sales, the supply chain and finance into one view, so a team works from the same figures instead of five people reading five different spreadsheets. The catch is that asking Claude for "a dashboard" in one prompt tends to produce a page full of decoration with no plan behind it. This guide covers what Claude dashboards can do and the five questions, drawn from decades of information-design research, that turn one into a dashboard people actually use.
What Claude dashboards are and where to find them
Claude dashboards are a dashboard type inside Claude's Artifacts, built by asking Claude in plain English. Every dashboard you create is saved in Artifacts, so that is also where you go back to find one.
Where the dashboard button lives
Click Artifacts in the sidebar and the Dashboard button sits at the top. Asking for a dashboard in any chat does essentially the same thing.
Which Claude plans include dashboards
Claude dashboards are on every paid Claude plan, so anyone who already uses Claude Code has them. On Enterprise plans the feature is switched off by default while it is in beta, and the company's account owner has to turn it on first.
What makes them different from a chart in a chat
Three things set Claude dashboards apart:
- Several data sources at once. A dashboard can pull from every app already connected to Claude, and Claude now also connects to the data warehouses Snowflake, BigQuery and Databricks.
- They refresh on their own. A dashboard can update its numbers without anyone asking.
- They can be shared with the rest of a team.
Why one prompt gives you a vibe-coded dashboard
A dashboard built from a single "make me a dashboard" prompt usually comes back vibe-coded: it looks like AI made it without any intention or plan. Claude fills the gap with chart junk, decoration that does not serve the dashboard's purpose.
The fix is to approach Claude dashboards deliberately, through five questions: the why, the where, the what, the how and the when. None of them is new. They come from information-design research going back decades, which is exactly why they still hold when an AI does the building.
| Question | What it decides |
|---|---|
| Why | The dashboard's single goal |
| Where | Which data sources feed it |
| What | The few metrics that earn the top of the page |
| How | The layout and design, without chart junk |
| When | How often the numbers refresh, and where the data lives |
Dashboard design starts with the goal: operational, strategic or analytical
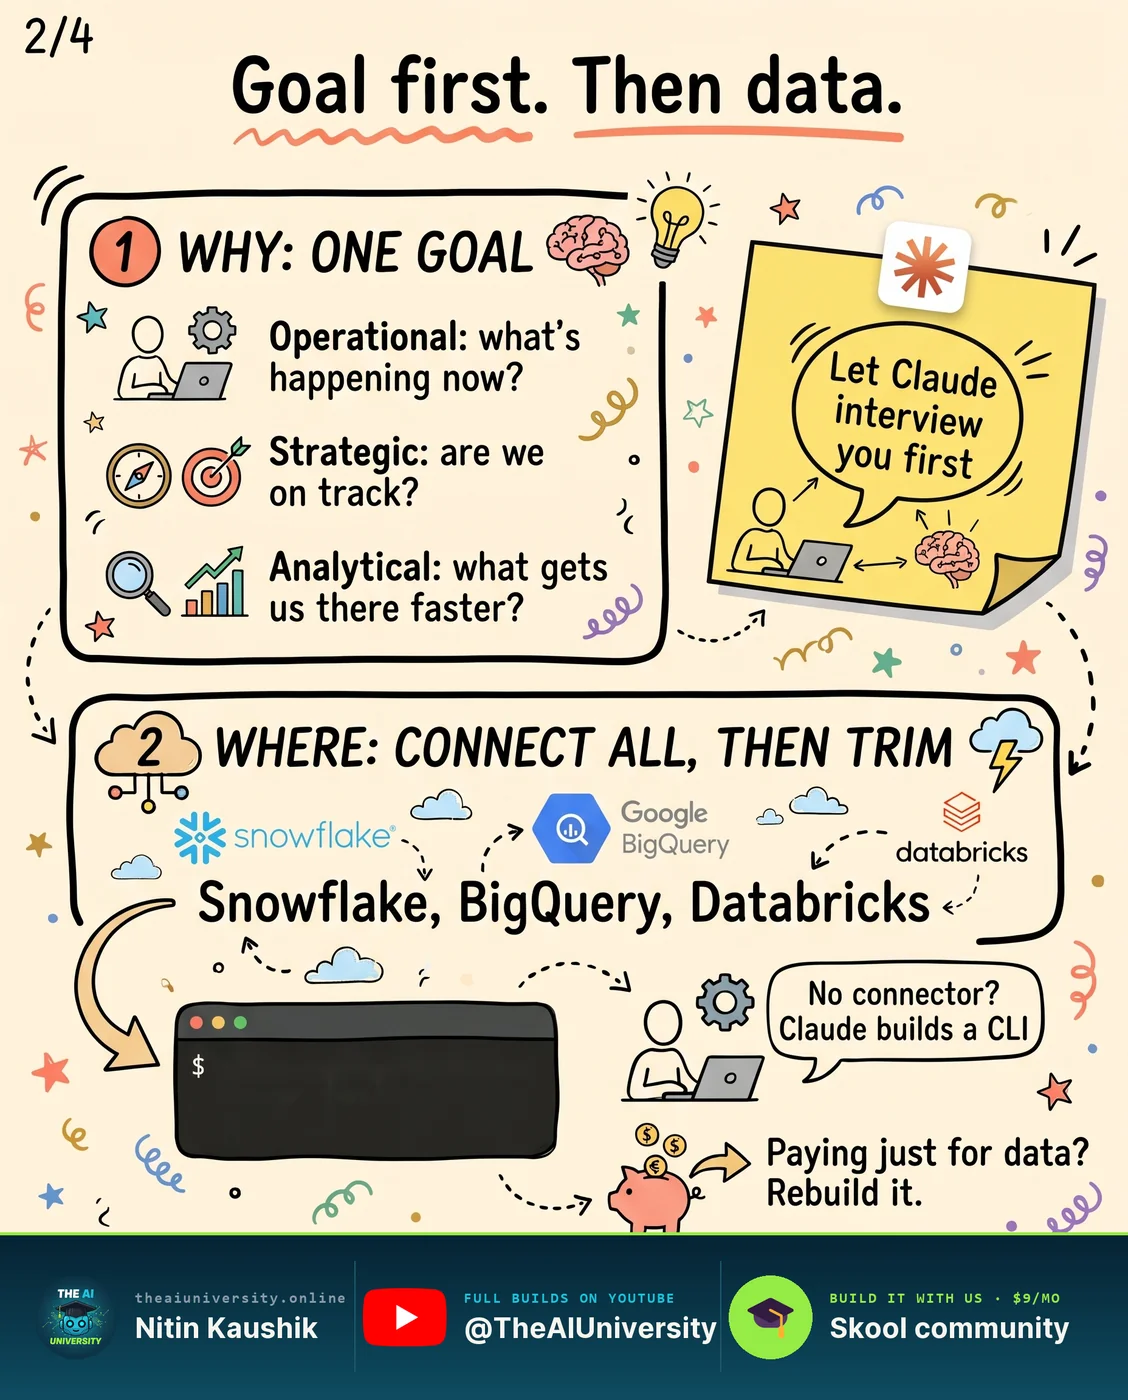
Dashboard design starts with one goal, because a dashboard without a clear goal ends up as a wall of numbers. "What is the goal?" is a broad question, so the seminal 2006 book Information Dashboard Design narrows it to three types of dashboard.
- Operational dashboards answer "what is happening right now?" A software company could show open support tickets by how long they have been waiting, so the support team sees which customers need a reply this minute.
- Strategic dashboards answer "are we on track for our goals?" They are the kind management teams ask for most often, for example monthly revenue plotted against this year's revenue target.
- Analytical dashboards answer "which insights get us to our goals faster?" The same software company might compare customers who cancel with customers who stay, to find the behaviours that push people one way or the other.
Picking the type narrows the goal, and that choice shapes the other four questions. It is the step that gets skipped when someone asks for the dashboard straight away. A better way is to let Claude interview you, one question at a time, until the two of you agree on the dashboard's purpose before it spends any tokens building it.
Claude connectors: connect every data source, then trim
Claude connectors are how a dashboard reaches your data, and in the AI age the order of work can flip. Defining metrics first used to make sense. With current models able to process so much at once, you can connect every data source the business has, including minor ones that never seemed worth connecting, then work with Claude to find the relevant ones and trim the rest.
Connectors are added under Customize → Connectors, where a data warehouse such as Snowflake can be found and added in a few clicks. Claude can also add a connector for you if you ask it to.
When your app has no connector
A missing connector does not mean a missing data source. Claude's latest models can usually build one. In the source example, a fitness app with no official connector got a CLI (a command-line interface), which is a type of connector Claude wrote to pull the app's data. You do not need to know how to build a CLI yourself, because Claude does the building.
Rebuilding data you only pay a tool for
If you pay for a tool mainly for its data, Claude may be able to work out how that tool gets the numbers and get them for you. The example is VidIQ's outlier score for YouTube videos, which shows which videos are getting unusual attention in a niche. At its core the score compares a video's views with the channel's average, and Claude can usually work out even a more complex version. Test whether Claude's results roughly match the tool's, decide whether they are good enough as a data source, and then decide whether to keep paying for that subscription.
Metrics that matter: put 3 to 5 big numbers at the top
Metrics that matter are the few numbers that serve the dashboard's goal, and finding them is the step where business judgement counts most. You know your business and your industry best, so go back to the goal, give Claude your business goals as well, and ask which metrics matter among all the sources it can now see.
Once those metrics are chosen, they get the most prominent place on the page: the top 3 to 5 numbers sit right at the top, and everything else follows below, with expandable "more info" sections at the bottom if needed. Information designers call these headline figures BANs, politely expanded as "big aggregate numbers".
The BANs follow from the dashboard type:
- On a strategic dashboard, the BANs are the actuals against the targets, such as actual revenue next to target revenue.
- On an operational dashboard, they are the numbers that need action now, such as how many urgent support tickets are waiting for an answer.
How to avoid chart junk in a Claude dashboard
Chart junk is anything on the page that is there for decoration and does not serve the dashboard's goal, a term from Information Dashboard Design. A Claude dashboard avoids it by dropping the usual offenders:
- No flashy 3D gauge charts
- No speedometer graphs, which are widely frowned upon
- Few pie charts, which many analysts consider weak, especially with several categories
A dashboard only works if it summarises. If every number is on the page, the result is closer to a glorified spreadsheet that looks a little better.
Start from a reference design system
Claude can handle the design, and it helps to give it a reference design system if your business does not have one yet. Sites such as Refero Styles, Mobbin and Dribbble have plenty. Screenshot two or three you like, adjust them to your brand colours, and ask Claude for mockup layouts to choose from before it builds the final dashboard. Refero Styles is especially handy because its design systems come with a written markdown file that an agent can absorb as text, and you can send Claude the link and ask it to recommend three designs that suit your business.
Refine the dashboard with comments
Once the design is locked in and the dashboard is built, you refine it with comments, much like a Google document. Click a number, such as gross margin, leave a comment like "compare this with last quarter", and send it to Claude to make the change.
Add a chat box with AI-powered artifacts
AI-powered artifacts take a dashboard further. Switch them on under Settings → Capabilities, then ask Claude to add a chat box inside the dashboard. Anyone on the team can type a question there, and Claude answers from the dashboard's data. That helps in two ways: a wider audience opening a shared link can get what they need by asking, and teammates who don't use Claude can open the dashboard in a browser and use the chat box without learning anything new.
How often should a Claude dashboard refresh?
A Claude dashboard should refresh as often as the people reading it need fresh numbers, and no more often. A dashboard is only useful if its numbers are current, but every refresh costs tokens.
A dashboard just for you vs a team dashboard
- Just for you: refresh when you open it. If nobody is looking, it is not silently running in the background and consuming tokens.
- For a team: refresh on a schedule, because people open it at different times. For example, every weekday at 7 in the morning, Claude can pull yesterday's numbers and update the dashboard before anyone opens it.
Live data or data stored in the dashboard
The second decision is whether the dashboard pulls data live every time it opens or stores the data inside itself. By default a shared dashboard uses the connections of whoever opens it, so teammates need the same apps connected to see the live parts. A Claude dashboard can instead store its data, with 100 MB for numbers and text and 1 GB for files such as images or icons, which is more than enough for most dashboards and lets others view it without your connectors.
Is storing data in a dashboard safe?
Storing data in a Claude dashboard means sharing that data with Anthropic, much as a business already shares data with Microsoft through SharePoint or with Google through Gmail and Drive. It becomes a business decision based on how sensitive the data is and whether the benefits of hosting the dashboard inside Anthropic's ecosystem outweigh the risks.
Why dashboards still matter in the AI age
Dashboards are not going away just because an AI can answer questions about the data. As long as people prefer visual summaries that explain numbers at a glance, a well-built dashboard stays the fastest way for a team to see what is going on. Claude dashboards make the building fast and the editing conversational. The five questions make the result worth opening: one goal, the right sources, a few big numbers, no chart junk, and a refresh schedule that matches who reads it.
Frequently asked questions
What is a Claude dashboard?
A Claude dashboard is a live dashboard that Claude builds inside Artifacts from the apps and data warehouses connected to your account, designed and edited in plain English. It can combine several data sources, including Snowflake, BigQuery and Databricks, refresh its numbers on its own, store its data, and be shared with a team. Every dashboard you create is saved in Artifacts.
Do I need Claude Enterprise to build dashboards?
No, you don't need Claude Enterprise to build dashboards: Claude dashboards are on every paid Claude plan, so anyone with Claude Code already has them. Enterprise is the one case where the feature starts switched off, because it is still in beta, and the company's account owner has to turn it on before team members can use it.
How is a Claude dashboard different from a spreadsheet?
A Claude dashboard summarises, while a spreadsheet lists. A good dashboard puts the 3 to 5 numbers that serve one goal at the top and leaves the detail underneath, so a team reads the same figures in seconds. A dashboard that shows every number on the page is, in effect, a glorified spreadsheet that looks a little better, and it loses the point of having a dashboard.
Does a scheduled dashboard use up Claude tokens?
Yes, a scheduled Claude dashboard uses tokens each time it refreshes, which is why the refresh choice matters. A dashboard only you read should refresh when you open it, so it never runs in the background unseen. A team dashboard is worth a schedule, such as weekdays at 7 AM, because people open it at different times and need the same fresh numbers.
Can Claude connect to Snowflake, BigQuery and Databricks?
Yes, Claude can connect to Snowflake, BigQuery and Databricks, and a dashboard can draw from them alongside the apps already connected to Claude. Connectors are added under Customize, then Connectors, or Claude can add one when asked. If a business app has no official connector, Claude's latest models can usually build one, for example as a command-line tool that pulls the app's data.
Keep reading
 video editing with Claude
Video Editing With Claude: 6 Effects Without After Effects
Video editing with Claude now covers the grade, the counter and the motion. Here are six effects and the one prompt line that makes them land.
Read article→ Reverse Engineer Anything
: Claude Can Now Rebuild Any App
Reverse Engineer Anything lets Claude look inside apps it has no code for. Here's how it works, who should skip it, and the software moat a copy can't take.
Read article→ AI agent skills
AI Agent Skills: 9 Free Ones and the Step Most Skip
AI agent skills install from one pasted link — that part is easy. The step that makes them genuinely useful is the one almost nobody runs.
Read article→