
SaaS Build · Source Code + Prompts
Multi-Chart Market Dashboard (8 Charts)
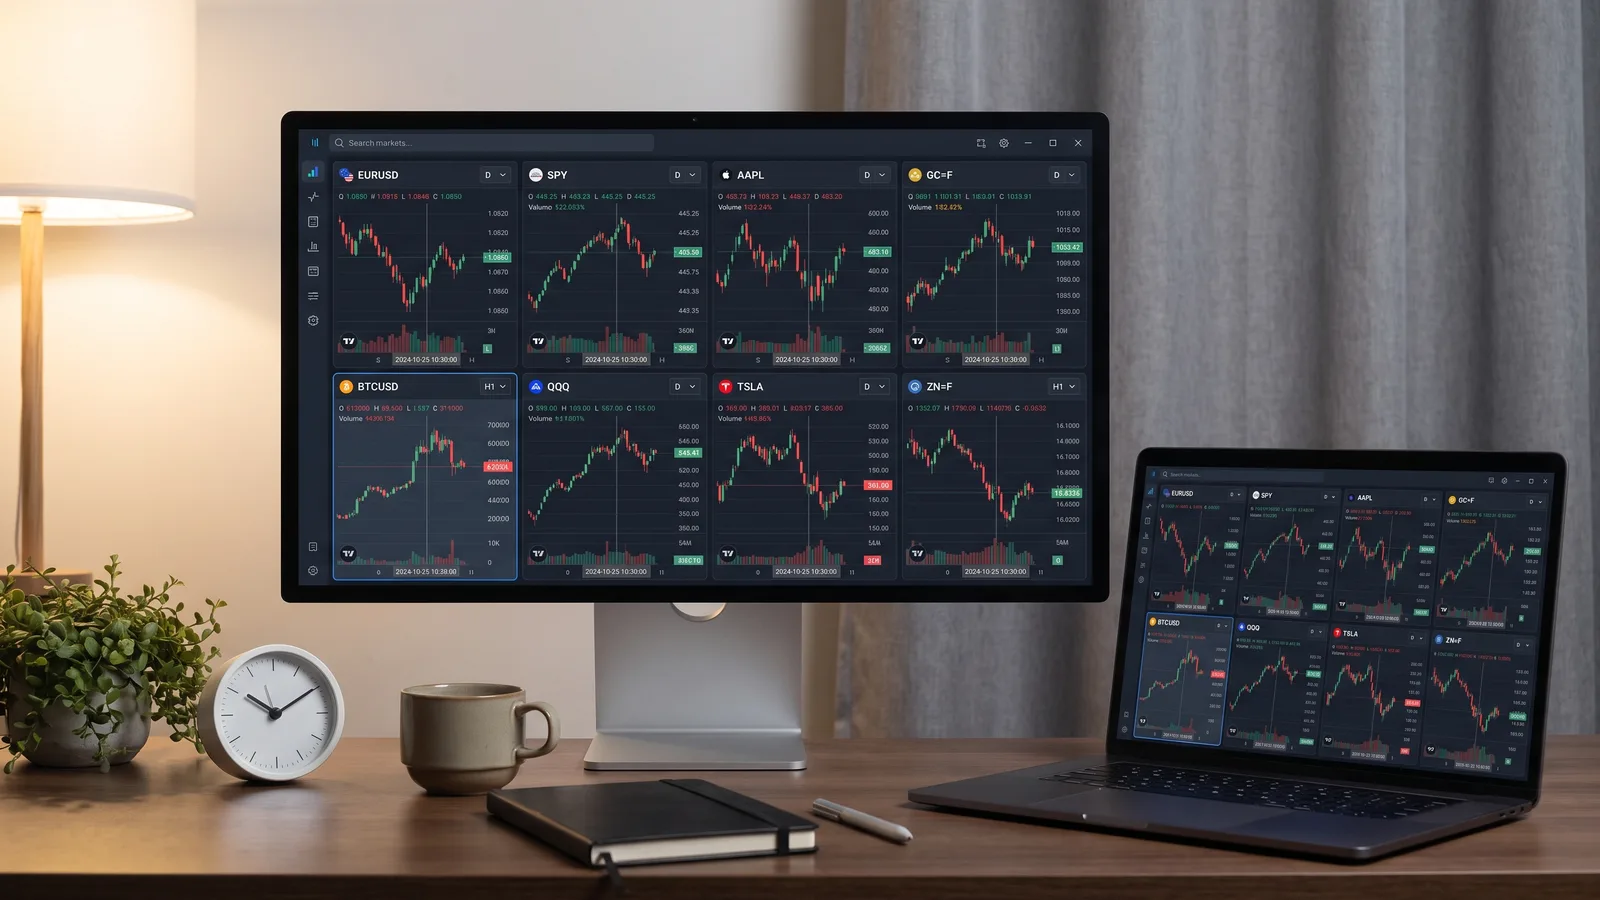
Complete source for an eight-pane live charting dashboard, plus the Claude prompts that built it. Built on TradingView's Lightweight Charts, with crypto streaming from Hyperliquid's public WebSocket and Indian equities through a small Flask proxy over yfinance. Every pane picks its own source, symbol and timeframe; the grid re-flows for 1, 2, 4, 6 or 8 charts and remembers your layout. A study in real-time data plumbing and chart rendering.
▶ Watch the build
What you get
- ✅ Complete, production-grade source code
- ✅ The exact Claude prompts used to build the entire app
- ✅ Step-by-step build walkthrough & documentation
- ✅ All downloadable resources, yours to keep
- ✅ Lifetime access from your library
⚠ Important Disclaimer
All products are provided strictly for educational and informational purposes. Nothing sold here constitutes financial, investment, trading, legal, or tax advice, nor a recommendation to buy, sell, or hold any security, derivative, commodity, or cryptocurrency.
The creator is not a registered investment adviser, research analyst, or broker with the SEC, FINRA, CFTC, NFA, any U.S. state securities regulator, or SEBI (as an Investment Adviser or Research Analyst). Trading involves substantial risk of loss — you can lose some or all of your capital. Past performance, actual or simulated, does not guarantee future results. Screeners and tools may produce incorrect, incomplete, or delayed output and rely on third-party data.
You are solely responsible for your own decisions. Software is provided “as is”, without warranty of any kind, and any liability is capped at the amount you paid. Licences are for personal use — the software may not be used for third-party funds or to provide advisory services. Read the full legal disclaimer →